

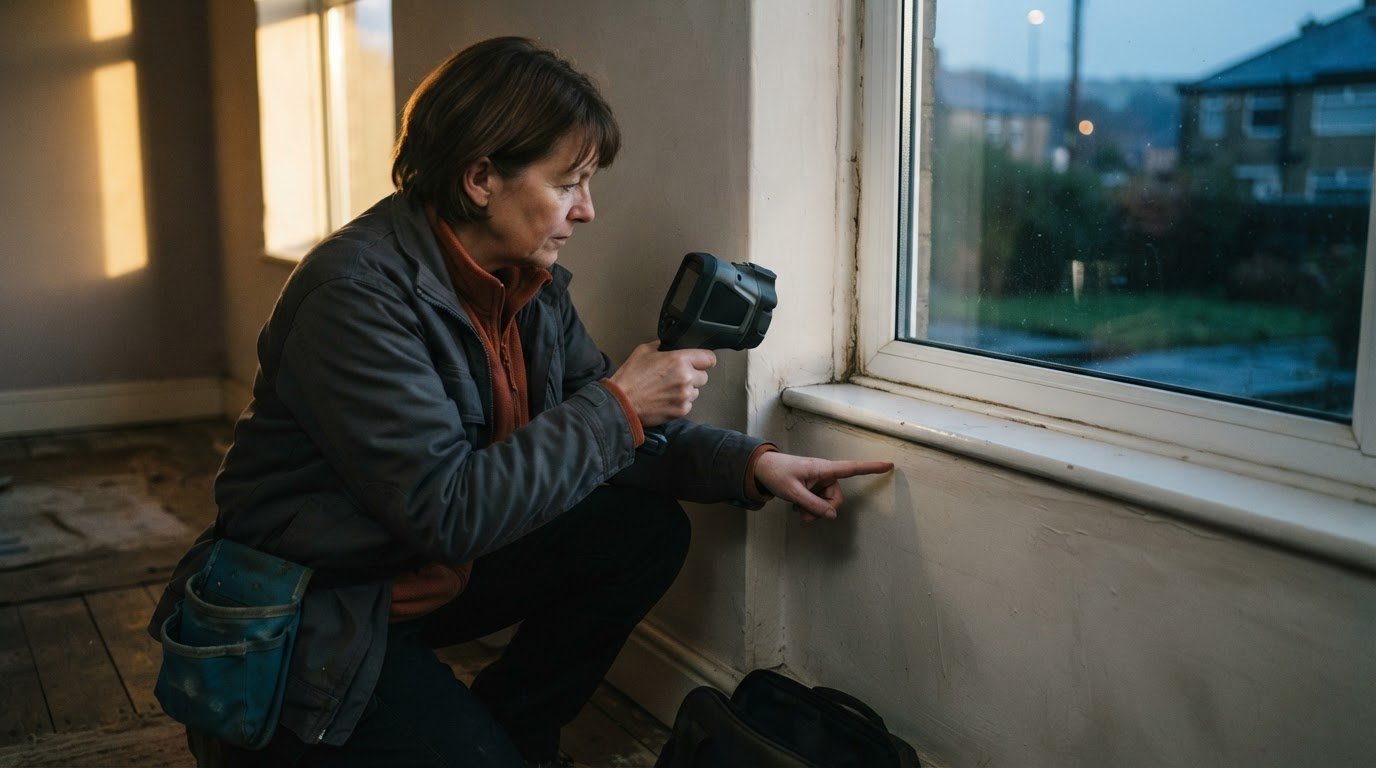
A thermal image can make a normal surface look concerning when its temperature scale is set poorly. Knowing how to read a thermal imaging report means looking beyond the colours: check the image’s temperature scale and range, compare like-for-like images over time, and note each finding’s location and severity. Colour alone does not confirm a fault.
It is understandable to focus first on a vivid patch or sharp contrast, but the palette and viewing conditions affect how an image appears. A sound interpretation considers the settings, the surface and other evidence together. Treat a striking image as a clue, not a conclusion.
This guide explains how temperature settings shape an image, what comparisons over time can reveal, and why colour should be interpreted cautiously. It also explains what clear annotations should communicate, so you can understand the report and identify findings that may need further investigation.
Key Takeaways
- Adjust the temperature level and span to bring meaningful differences into view without making ordinary conditions look alarming.
- Compare images from the same test point and item over time to spot changes in their temperature signatures.
- Read colours in the context of the selected palette, and cross-check apparent anomalies against physical inspection and other diagnostic information.
- Look for clear annotations that identify each finding’s location and severity, so you can understand what may need further attention.
1. Adjusting image temperature level and span
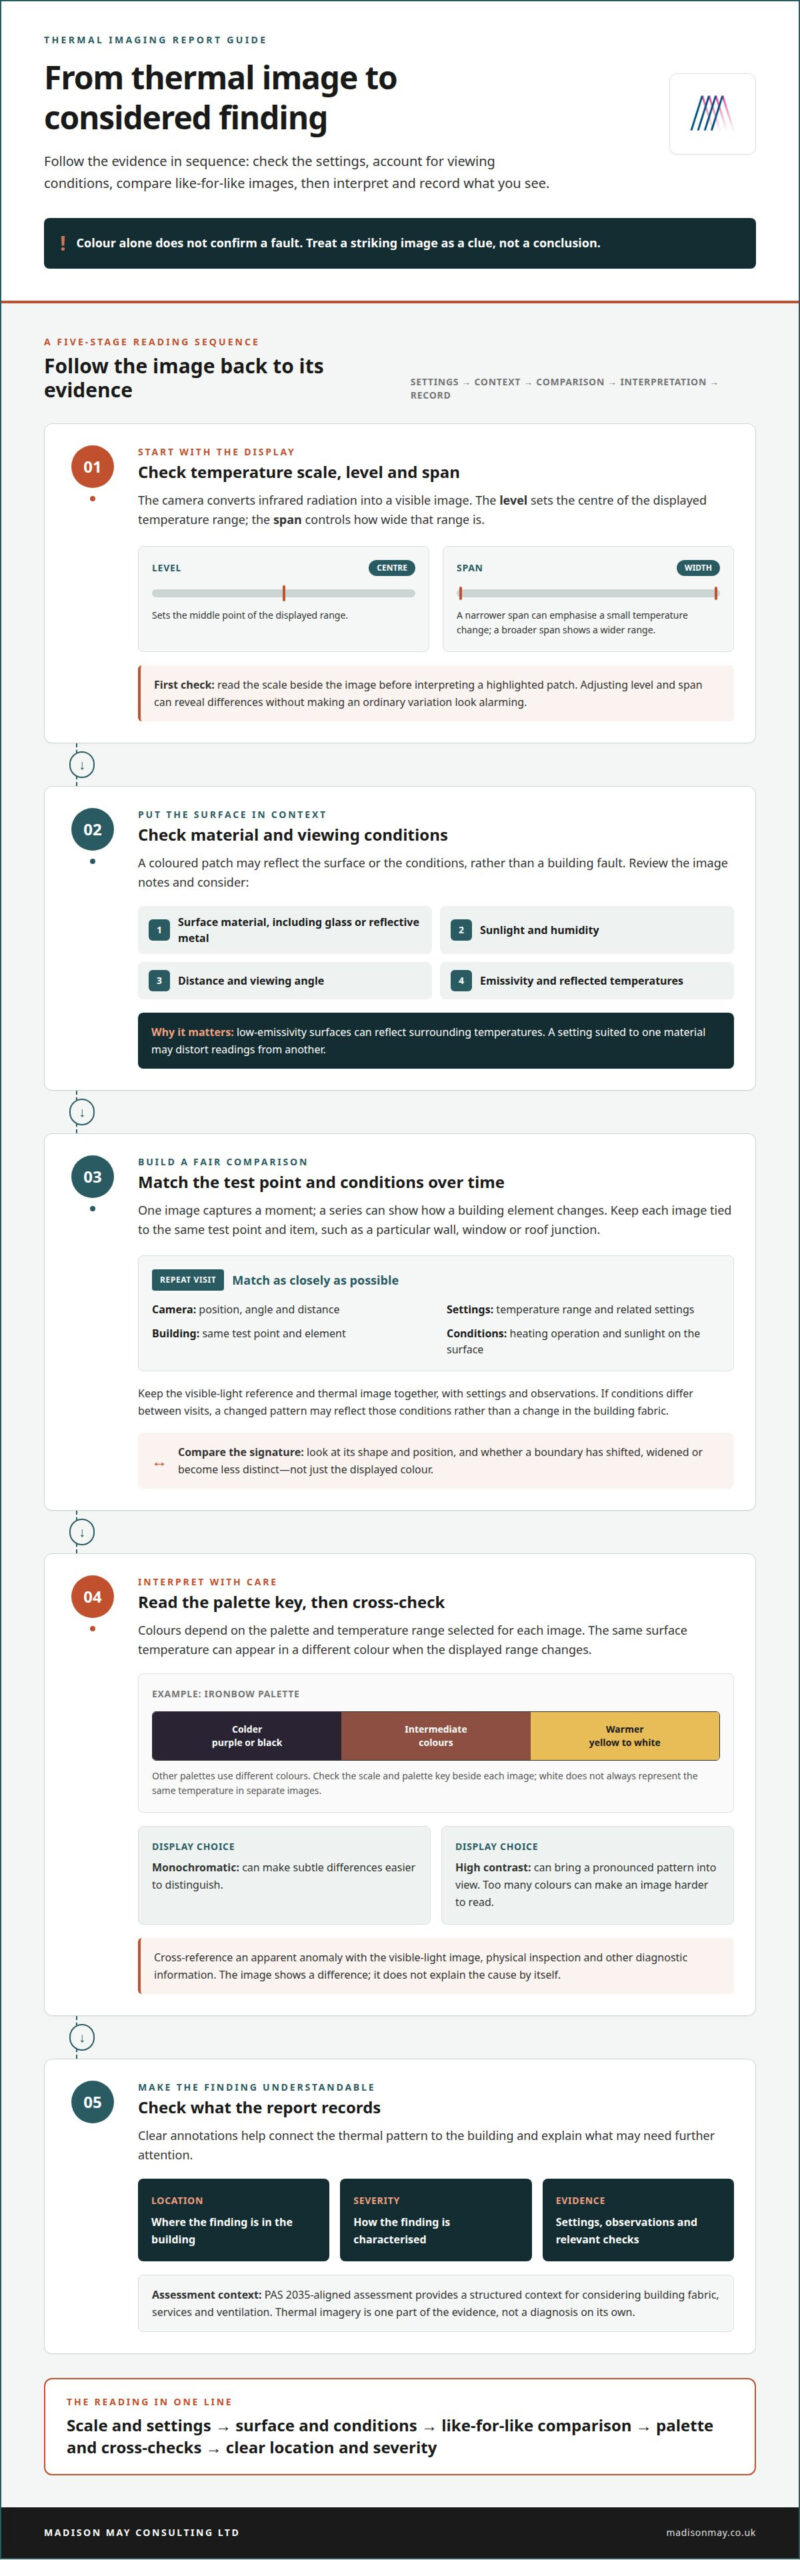
A thermal camera detects infrared radiation and converts it into a visible image. The temperature level sets the centre of the displayed range, while the span controls how wide that range is. Adjusting both can reveal areas that differ from their surroundings without making an ordinary variation look alarming. For example, a narrow span may emphasise a small temperature change across a wall, while a broader span shows a wider range. Check the scale beside the image before interpreting a highlighted patch.
For UK retrofit work, PAS 2035-aligned assessment provides a structured context for considering building fabric, services and ventilation. Thermal imagery should be read alongside the report’s stated settings and observations, rather than treated as a diagnosis on its own. A home energy survey uses the image to help identify patterns, such as a cooler area that may warrant investigation, then considers that pattern with other building information.
First check the image’s temperature scale, level and span. Then note the surface and conditions: glass, reflective metal, sunlight, humidity, distance and viewing angle can affect readings. Emissivity matters too, because low-emissivity surfaces can reflect surrounding temperatures. A setting suited to one material may distort readings from another. These details help explain why a coloured patch does not automatically indicate heat loss or a defect.
A visible-light image can be blended with a thermal image to show the surrounding scene alongside areas outside the selected temperature range. Store images under the same test point and building element, such as a particular window, so later comparisons remain meaningful. Some thermal cameras also allow images to be uploaded or findings shared in real time, making it easier for colleagues to review the same evidence.
When you receive a report, start with the scale, settings and notes for each image. Match each finding to its location, then read the interpretation alongside any physical inspection or other diagnostic information. If the report identifies a concern, use its evidence to understand what further assessment or improvement may be appropriate. This measured approach puts vivid colours in proportion to the home’s wider condition.
2. Comparing temperature signatures over time
A single thermal image captures conditions at one moment; a series can show how a building element changes. Store each image against its test point and item, such as the same wall, window or roof junction. Keep the visible-light reference and thermal image together so the location remains clear when you review the records later.
To understand how to read a thermal imaging report across repeat visits, match the camera position, viewing angle, distance and temperature settings as closely as possible. Record relevant conditions alongside each image, including whether the heating was operating and whether sunlight reached the surface. If these conditions differ between visits, a changed pattern may reflect the conditions, not a change in the building fabric.
A useful way to learn how to read a thermal imaging report is to compare the shape and position of a signature, not just its displayed colour. A cooler strip beside a window, for example, is more informative if a similar pattern appears in that area in repeat images. Check whether the boundary has shifted, widened or become less distinct, then compare your observation with the report’s notes. The image can show a difference, but it cannot explain the cause by itself.
Emissivity and reflected temperature also affect comparisons. Emissivity describes how a surface emits infrared radiation, and low-emissivity materials can reflect surrounding temperatures. If one image uses a setting suited to glass and another shows a different surface, their readings may not be comparable. Treat reflective surfaces with particular care, and consider whether a reflected warm or cool area could explain the apparent pattern.
Organised records make trends easier to interpret: keep each test point’s images, settings and observations together. Where a recurring pattern relates to heat loss or building fabric, a retrofit assessment can place that evidence within a broader review of the home. This connects the thermal signature with other relevant building information, rather than treating an isolated image as a complete finding.
3. Limits of colour interpretation and cross-checking results
A thermal imaging report shows surface-temperature patterns across the photographed areas, alongside settings, observations and annotations. In a home, a cooler patch near a window or a warmer line along a junction is a visible difference, not a diagnosis of its cause.
Colours depend on the palette and temperature range selected for each image. In an Ironbow palette, colder areas appear purple or black, while warmer areas shift through yellow to white. Other palettes use different colours, so white does not always represent the same temperature in separate images. Check the scale and palette key beside each image before interpreting its colours.
The camera maps temperatures within its chosen range onto the available colours. The coolest area may appear dark and the warmest light, with intermediate temperatures shown between them. If the displayed range changes, the same surface temperature can appear in a different colour. Compare the scales, not just the colours, when reviewing two images.
Choose a palette suited to the task. A monochromatic display can make subtle differences easier to distinguish, while a high-contrast palette can bring a pronounced pattern into view. Too many colours can make an image harder to read. Shiny surfaces may reflect surrounding heat and appear cooler; rough surfaces can look warmer.
Thermal imaging has limits: sunlight, humidity, distance, viewing angle and reflected temperatures can affect readings. Cross-reference a patch with the visible-light image, physical inspection and other diagnostic information. Similar colours can represent different temperatures, so a vivid mark alone cannot confirm a fault.
For damp, insulation gaps and heat loss, a thermal pattern can point to an area for further investigation, but it cannot identify the cause by itself. A cooler region may relate to heat loss, while damp needs to be assessed alongside other evidence. Insulation upgrades should follow a considered understanding of the building, not colour alone.
4. Annotating problems, locations and severity
A useful report connects each thermal image to a recognisable place in the home. A digital-photo overlay can show a marked area beside its visible-light view, helping readers locate a finding without relying on infrared colours alone. For example, an annotation might identify the upper-left corner of a bedroom window rather than simply point to a cool patch in an image. Clear location details make findings easier to discuss and revisit.
Each annotation should explain three things: what the image shows, where it appears and how significant the report considers it. A note might describe a cooler area, locate it along a particular wall junction and state its assessed severity. This is more useful than a label such as “problem area”, which leaves the reader unsure what was observed or where to look. Severity should be explained in plain language, not left as an unexplained code.
Good reporting separates the observed pattern from its possible explanation. For instance, an image may show a distinct temperature difference around a window frame. The report can record the observation, identify the frame’s position and explain whether it merits further investigation, without presenting the image alone as proof of a defect. A physical inspection or other diagnostic information can put the finding in context.
Consistency matters across a report. Use the same location names in image captions, room descriptions and recommendations, so a reader can follow a finding from evidence to next steps. Pair each marked thermal image with a clear photograph and concise note; avoid overcrowding the image with arrows or technical terms. A structured building survey can help place annotated findings within a wider understanding of the home and its fabric.
Madison May Consulting
Madison May Consulting Ltd can help put thermal findings in the wider context of a home’s energy performance. If a report highlights possible heat loss, insulation gaps or ventilation concerns, a retrofit assessment can consider the building fabric, services and ventilation together. This connects image observations with practical options, rather than treating one colour pattern as a complete diagnosis.
Madison May Consulting Ltd provides detailed EPC improvement plans to identify practical energy-efficient home improvements, including insulation upgrades where appropriate. Windows, doors, conservatory upgrades, ventilation assessments and damp remediation may also be relevant to the issues identified. The right next step depends on what the report shows and how the wider property performs.
To discuss what your thermal findings may mean for your home, contact Madison May Consulting Ltd.
Turn your findings into a considered next step
A thermal image is most useful when it helps build a clearer understanding of your home, rather than becoming a conclusion in itself. Knowing how to read a thermal imaging report gives you a stronger starting point for discussing what the findings could mean and which areas deserve attention. Connect those observations with your priorities for comfort, energy use and how you use each room.
Madison May Consulting Ltd can help you consider energy-efficient home improvements in the context of your property. Depending on your needs, these may include windows and doors or conservatory upgrades. The aim is to bring the report into a broader conversation about practical improvements, with choices shaped around the home rather than a single image.
If you’re ready to discuss your findings and possible next steps, contact Madison May Consulting Ltd. A thoughtful plan can help you move from an uncertain image towards a home that feels more comfortable and works beautifully for everyday life.
Frequently Asked Questions
How do you interpret colours and temperature ranges in a thermal image?
Use the image legend to understand how its selected temperature range is displayed. For a practical reading, identify a marked area, note its reported temperature if shown, then compare it with a nearby surface in the same image. A colour’s meaning depends on that image’s palette and scale, so do not automatically apply the interpretation from one report image to another.
What do hot spots and cold spots indicate in a thermal imaging report?
Hot and cold spots show areas with apparent surface temperatures that differ from their surroundings. A warm patch near a radiator, for example, may relate to the heat source, while a cool patch at an external corner may merit closer examination. The report’s location notes and other inspection findings help distinguish a relevant pattern from an expected temperature difference.
How do you read emissivity, reflected temperature and measurement accuracy notes?
Read these notes as context for how the camera measured a particular surface. Emissivity relates to how a material emits infrared radiation; reflected temperature describes surrounding heat that may affect its apparent reading. For example, a note about a reflective surface can explain why its measurement needs care. Use accuracy details to understand the stated limits, not as proof that a building issue exists.
What UK standards or guidance apply to building thermography reports?
For UK retrofit work, PAS 2035-aligned assessment provides a structured context for considering building fabric, services and ventilation. Thermal imagery should be read alongside the report’s settings and observations, not treated as a diagnosis on its own.