

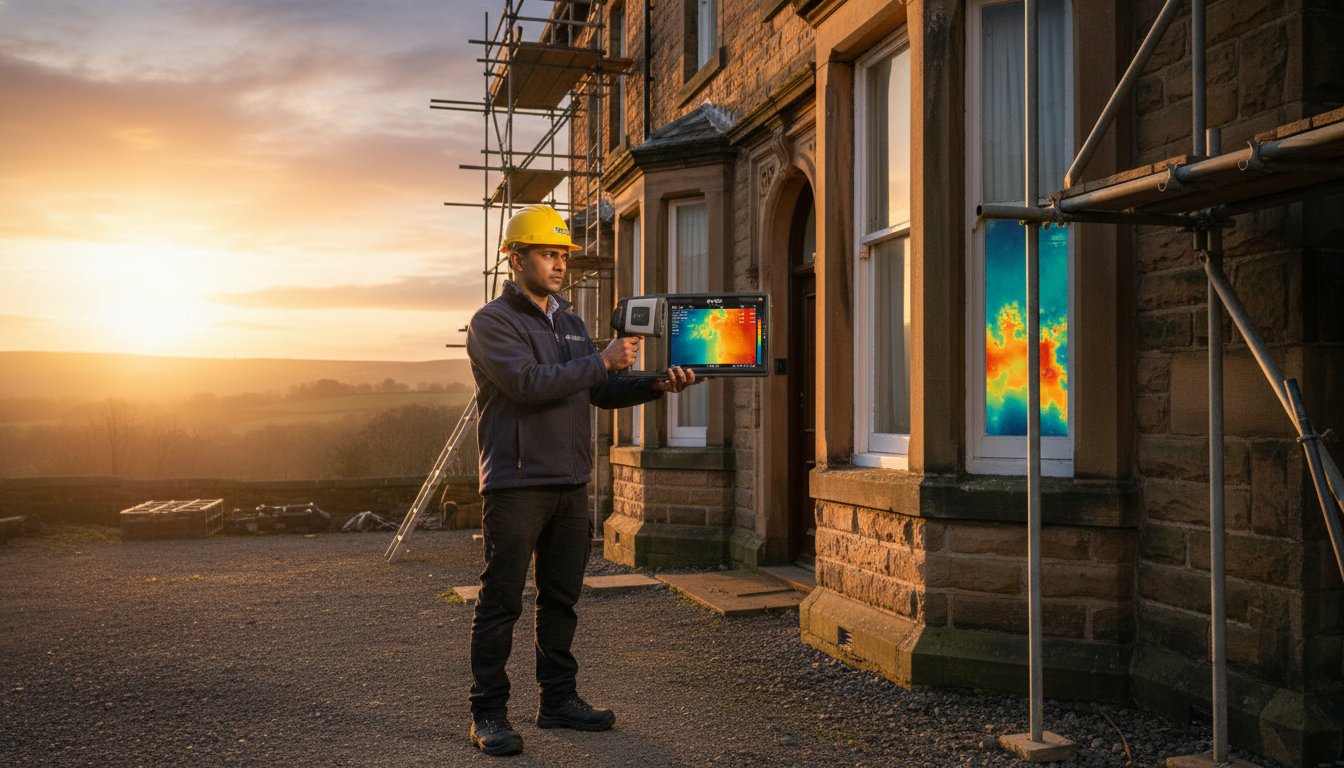
Imagine standing in your hallway on a crisp morning in early 2026, noticing for the first time that the draft which once haunted the floorboards has vanished into a quiet, curated warmth. It’s a common frustration to feel this physical transformation while still questioning if the numbers on your screen truly reflect the investment made in your home’s soul. You likely understand that while Energy Star suggests properly insulating a home can reduce heating and cooling costs by up to 15%, the reality of fluctuating weather patterns often makes these gains difficult to isolate from the noise of daily life.
This guide serves as your sophisticated companion in measuring energy savings after insulation, offering a bridge between technical metrics and the emotional peace of a well-crafted environment. We’ll move past the cold complexity of kWh and U-values to provide a clear, professional framework for year-over-year data normalization. By the end of this exploration, you’ll possess the analytical tools to validate your home’s performance and the confidence to know your sanctuary is functioning with the meticulous efficiency it deserves.
Key Takeaways
- Learn why raw utility bills often deceive and how to isolate the genuine 15% reduction in heating costs that Energy Star correlates with high-quality insulation.
- Master the art of measuring energy savings after insulation by utilizing Heating Degree Days to account for the unique climate variations of West Yorkshire.
- Discover how technical metrics like U-values translate the invisible essence of warmth into a meticulously curated narrative of your home’s efficiency.
- Balance professional data with a sensory audit of relative humidity to ensure your sanctuary remains a breathable and damp-free environment.
- Explore how a PAS 2035 assessment provides the ultimate professional validation of your investment and your home’s new energy status.
The Narrative of Efficiency: Why Raw Utility Bills Often Deceive
The journey of thermal transformation is a quiet, evocative process. It begins with the soft sealing of a persistent draft and concludes with a home that finally feels like a curated sanctuary. However, the financial validation of this meticulous craftsmanship is often clouded by the very documents meant to provide clarity. When you begin measuring energy savings after insulation, the most common pitfall is relying solely on the total amount due on your monthly utility bill. Comparing January 2025 to January 2026 is rarely a direct comparison. It’s a complex narrative shaped by external market volatility and subtle internal lifestyle shifts.
Energy prices are rarely static. A significant drop in your home’s energy consumption can be completely obscured by a sudden spike in national energy tariffs. Similarly, your own personal story within the home evolves. If your household transitioned to working from home more frequently in early 2026, your baseline energy demand naturally increased. This shift creates a “new normal” that can make your insulation’s performance appear underwhelming on paper, even as it works tirelessly to maintain a stable internal climate. There is also the psychological “rebound effect” to consider. When a home feels more efficient, there’s a natural tendency to turn the thermostat up a fraction higher, enjoying a level of warmth that was previously too expensive to maintain.
Distinguishing Cost from Consumption
True accuracy in measuring energy savings after insulation requires a shift in perspective, moving your focus from pounds sterling to kilowatt-hours (kWh). While currency fluctuates, the kWh remains the only constant measure of the energy required to sustain your sanctuary’s essence. You can find this data easily on a modern smart meter or tucked within the detailed breakdown of a traditional paper bill. Before any work commences, establishing a meticulous baseline through a professional energy audit or by recording twelve months of previous usage provides the necessary context to separate your home’s performance from the noise of the global energy market.
The Role of the External Environment
West Yorkshire’s unique Pennine microclimates present a specific challenge to performance verification. Our region is defined by biting winds and damp mists that test the soul of any building. A particularly harsh winter in 2026 can mask the efficiency of even the most bespoke loft insulation if you only look at the total heat used. The goal of high-end retrofit work is to reach a state of thermal equilibrium. This is the point where the home retains its heat with effortless grace, regardless of the frost blooming on the windows outside. To see this clearly, we must look past the raw numbers and account for the severity of the season itself.
Quantifying the Essence of Warmth: Key Metrics for the Discerning Homeowner
Moving beyond the abstract figures on a utility bill requires a deeper look into the technical poetry of your home’s structure. While the previous section explored why raw costs can deceive, measuring energy savings after insulation involves understanding the specific metrics that define a high-performing sanctuary. Central to this is the U-value, a meticulous calculation that reveals exactly how much heat escapes through the walls, floors, and roof of your property. It’s the difference between a house that merely exists and one that actively protects its inhabitants from the Pennine chill.
Your home’s theoretical performance is often predicted through SAP (Standard Assessment Procedure) calculations. These aren’t just dry numbers; they form a narrative of potential, showing how a bespoke insulation upgrade can transform a draughty Victorian terrace into a modern thermal masterpiece. However, even the most advanced materials can be compromised by thermal bridging. This occurs when a single uninsulated spot, perhaps a window lintel or a floor joist, allows heat to bypass your new thermal envelope. It’s a reminder that true efficiency requires a whole-house perspective, ensuring no detail of the building’s soul is left unattended.
Smart thermostats provide an evocative way to track this transformation in real-time. By monitoring “heat-up” and “cool-down” times, you can observe how much more effectively your home holds onto its warmth. A sanctuary with a high-performing thermal envelope will require less active heating to maintain its essence, reflecting a seamless integration of functionality and comfort. Many homeowners find that these sensory observations, backed by data, provide the technical peace of mind they’ve been seeking.
U-Values vs. R-Values in the UK Context
In North America, you’ll often hear of R-values, which measure thermal resistance. In the UK, we prefer the sophistication of the U-value. A U-value is the rate of heat transfer through a square metre of structure. For the discerning homeowner in West Yorkshire, the goal is always a lower number. While an uninsulated solid wall might have a U-value of 2.1 W/m²K, a meticulously executed insulation upgrade can bring this down to 0.30 W/m²K or lower, representing a profound shift in how your home retains its warmth.
The Smart Meter as a Diagnostic Tool
Modern technology offers an intimate look at your home’s performance through half-hourly data. By observing how your property retains heat overnight, you can see the tangible impact of your investment. A well-insulated home will show a graceful, steady temperature curve rather than a sharp drop. Many owners now use professional home energy assessments to supplement this data, identifying the “baseload” energy use required to keep the house breathing. Exporting this information allows for a meticulous analysis of your thermal journey, proving that your sanctuary is now as efficient as it is beautiful.
The Meticulous Comparison: Normalising Data for True Accuracy
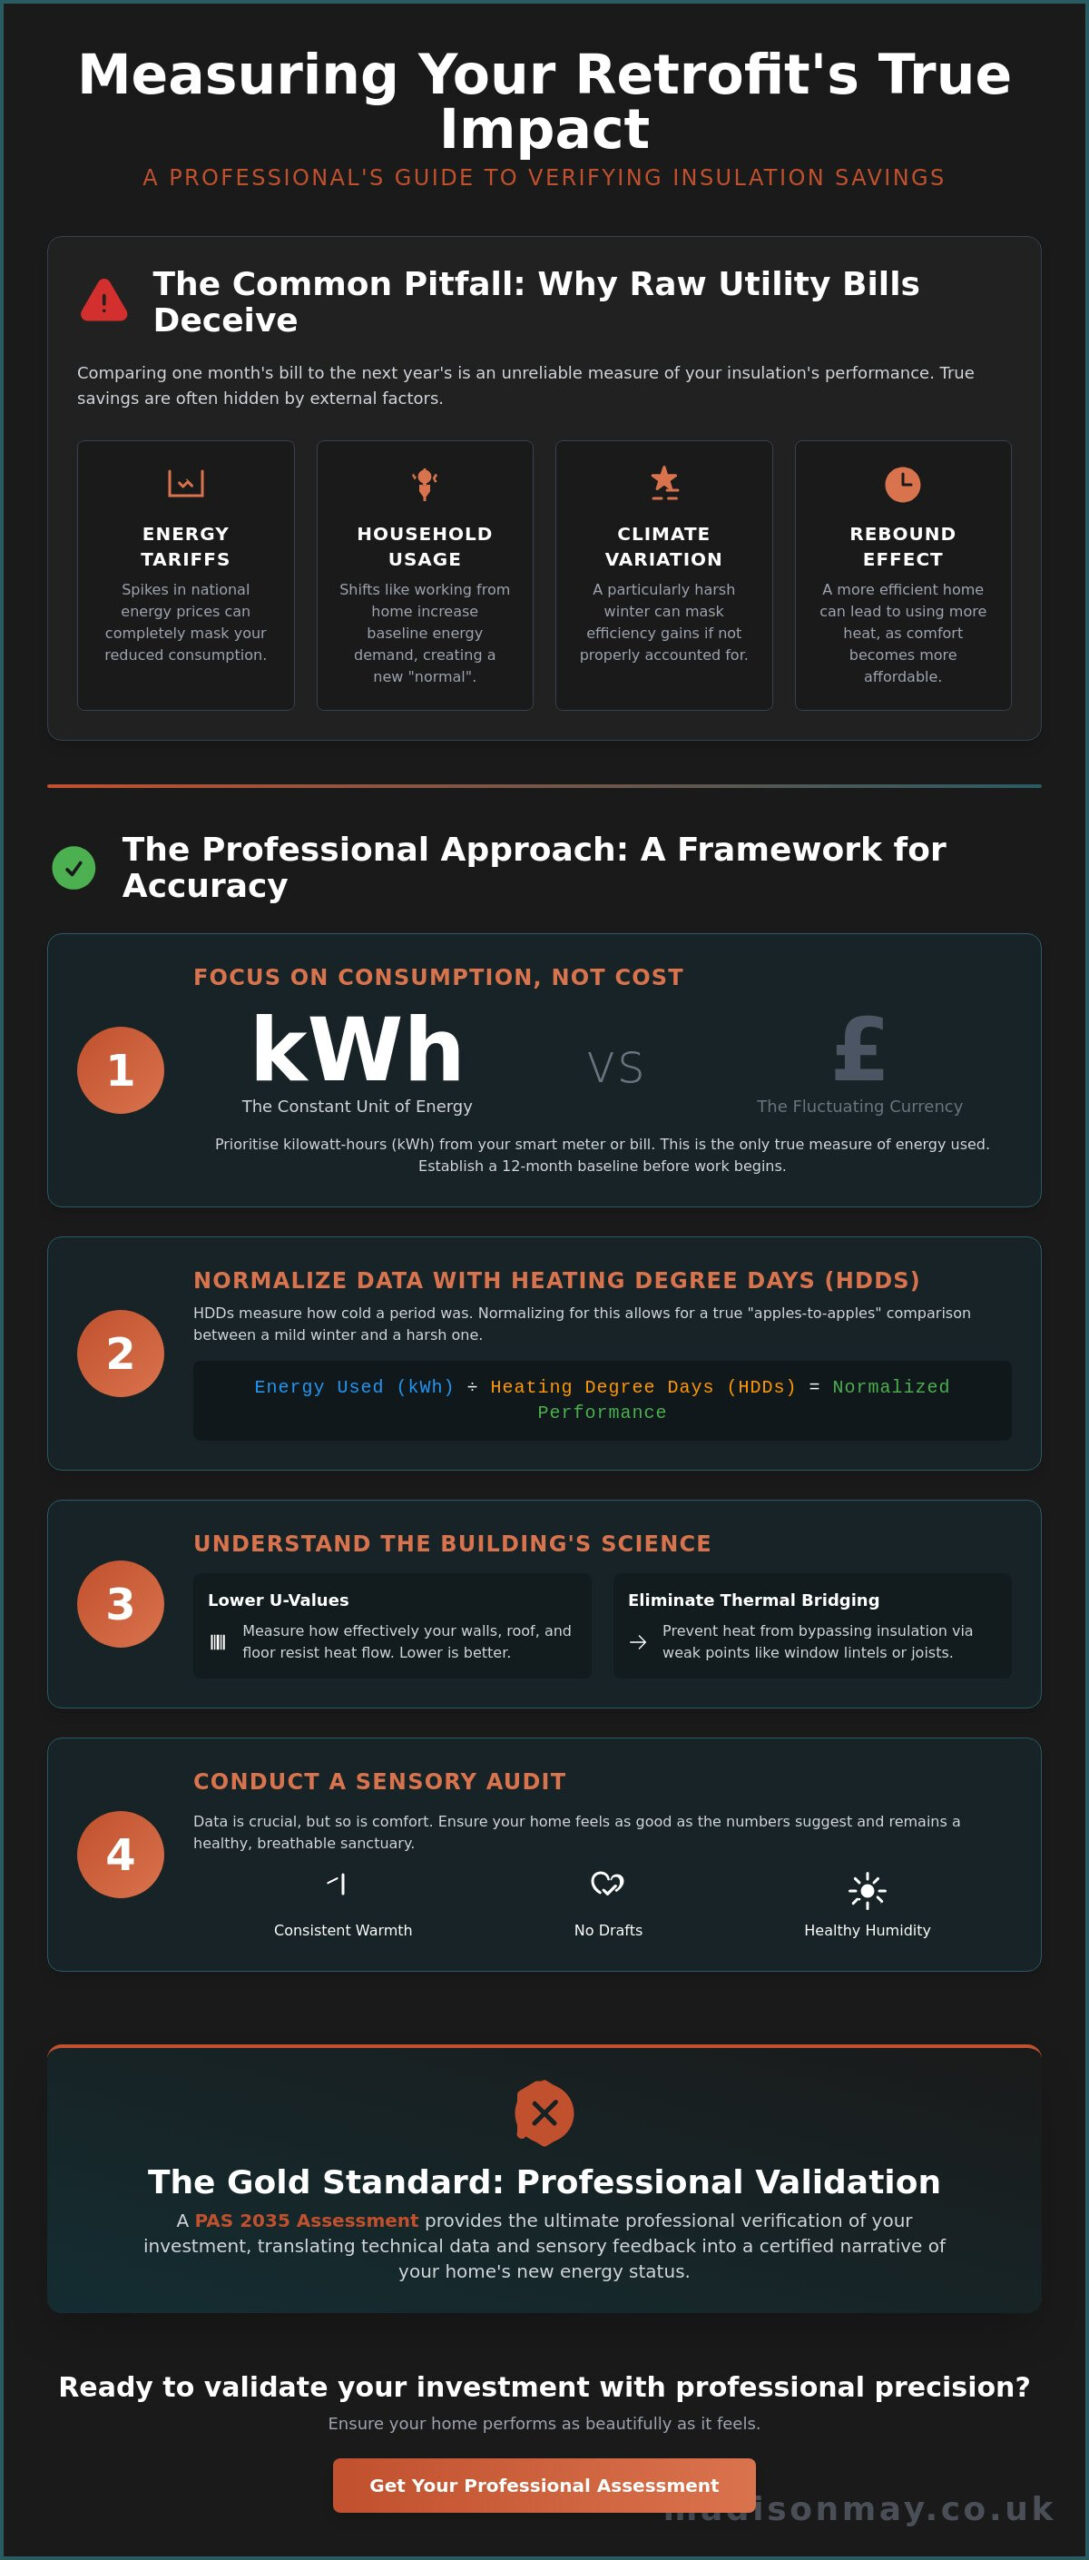
To truly understand the essence of your home’s thermal evolution, you must look beyond the surface of raw data. The primary challenge of measuring energy savings after insulation lies in the erratic nature of the British weather. A mild winter might suggest savings that don’t actually exist, while a severe frost can mask the meticulous work of a professional installer. This is why the concept of “Heating Degree Days” (HDD) is an essential tool for the discerning homeowner. HDD is a metric that quantifies how much, and for how long, the outside air temperature falls below a specific base level, typically 15.5°C. By comparing your energy consumption to these figures, you can strip away the climate noise and reveal the true performance of your property’s soul.
For those living within the rolling landscapes of Halifax and the wider West Yorkshire region, local HDD data is readily accessible through specialized meteorological services. By dividing your total kilowatt-hours (kWh) by the number of degree days in a specific period, you arrive at your “kWh per Degree Day.” This figure represents the heartbeat of your home’s efficiency. It allows you to see if your sanctuary is using less energy for every degree of warmth required. If you utilize secondary heating sources, such as a bespoke wood burner or curated electric heaters in a garden studio, these must be accounted for to ensure your narrative of efficiency remains untarnished and accurate.
A 5-Step Framework for Performance Verification
Achieving technical peace of mind requires a structured, patient approach. First, gather 12 months of pre-insulation kWh data alongside local HDD figures to establish your baseline. Once your thermal transformation is complete, collect at least three months of post-insulation data during the heating season. This allows you to calculate the “Energy Signature” of your property, identifying the specific slope of your heating demand. Finally, normalize this data against a “standard” weather year. This meticulous process ensures that your findings are grounded in reality, providing a clear comparison that transcends the unpredictability of the seasons.
Visualising the Transformation
There is a profound sense of satisfaction in seeing the invisible become visible through data. By plotting your normalized consumption on a simple graph, the “before and after” curve reveals the quiet success of your energy efficient home improvement. A successful project typically manifests as a 15% to 25% reduction in space heating requirements, a hallmark of quality craftsmanship. Documenting these findings does more than just validate your current comfort. It creates a lasting record of quality that can enhance future property valuations and support an updated EPC improvement plan, ensuring your home’s story of efficiency is told for years to come.
This level of data-driven insight is equally critical in the corporate world; for instance, manufacturing directors looking to scale these efficiencies across their operations can visit EnergoStrateg to explore advanced utility cost optimization platforms.
The Sensory Audit: Monitoring Comfort and the Sanctuary’s Breath
While technical data provides a necessary foundation, the ultimate validation of your home’s thermal transformation is found in the sensory experience of the space itself. True performance is measured not just in the cold decimals of a spreadsheet, but in the quiet restoration of a room’s soul. The process of measuring energy savings after insulation is as much about the restoration of comfort as it is about the reduction of kilowatt-hours. A meticulously insulated sanctuary should feel balanced, with a consistent warmth that envelops you without the oppressive weight of stagnant air. This sensory audit is the bridge between professional data and the personal story of your home.
A critical component of this audit is monitoring relative humidity. When we seal a building’s envelope to prevent heat loss, we inevitably alter its natural ventilation patterns. Without a whole-house approach, insulation can inadvertently trap moisture, leading to the very issues we seek to avoid. Professional damp remediation ensures that your thermal upgrades coexist in harmony with the building’s structure, preventing interstitial condensation before it begins. You can perform a simple ‘Barefoot Test’ to assess this harmony. By walking through your home, you should feel a thermal consistency where floor and wall surface temperatures no longer bite with a sudden chill.
Indoor Air Quality and Ventilation
Adding insulation must be balanced with meticulous ventilation strategies to maintain a healthy environment. It’s a common misconception that a warm home is a healthy one; in reality, it must also be a breathable one. Low-cost digital hygrometers, often available for under £20, allow you to track the ‘breath’ of your sanctuary, aiming for a curated humidity level between 40% and 60%. Understanding the ‘dew point’ is essential here. By raising the internal surface temperature of your walls through insulation, you effectively move the dew point away from the room, preventing the unsightly condensation that often plagues older West Yorkshire properties.
Thermal Comfort and the Absence of Draughts
The emotional impact of a high-performing home is most evident long after the boiler has clicked off. You can observe the success of measuring energy savings after insulation by tracking the reduction in ‘cold spots’ using a simple infrared thermometer, looking for a temperature variance of less than 3°C between the centre of a room and its corners. If inconsistencies remain, refining your sanctuary through targeted draught proofing can provide the final layer of protection. This process ensures that the warmth you’ve invested in remains exactly where it belongs. If you’re ready to begin your home’s thermal journey, consider a professional building survey to identify every hidden opportunity for comfort.
Professional Verification: The Role of Retrofit Assessments
The final stage of your home’s thermal transformation involves a transition from personal observation to professional validation. While the sensory audit and data normalization provide internal confidence, measuring energy savings after insulation finds its ultimate expression through formal verification. This isn’t merely a bureaucratic exercise; it’s the definitive closing of a chapter in your home’s story. A post-installation PAS 2035 assessment serves as the gold standard in this regard, offering a meticulous review that ensures every material and method aligns with the highest levels of craftsmanship.
This professional oversight ensures that the delicate balance between insulation, heating, and ventilation remains in seamless integration. It’s here that the technical peace of mind we’ve discussed truly crystallizes. By securing an updated EPC improvement plan, you translate the invisible essence of your home’s warmth into a tangible asset. Thermal imaging surveys further this narrative, allowing you to actually see the invisible cloak of warmth that now protects your sanctuary, identifying any minor thermal bridges that might have escaped a less meticulous eye.
The Meticulous Building Survey
During a performance verification visit, a qualified retrofit assessor conducts a deep exploration of the building’s envelope. They look past the aesthetic finishes to examine the integrity of the thermal barrier, often utilizing air pressure testing to quantify improvements in airtightness. A professional survey identifies hidden heat loss that DIY monitoring might miss. By measuring the air changes per hour (ACH), an assessor can prove that the draught proofing and insulation are working in concert to protect the home’s soul from the unpredictable West Yorkshire elements.
Investing in Long-Term Value
The value of these meticulous records extends far beyond immediate comfort. As we move past the 2025 introduction of the Future Homes Standard, properties that demonstrate verified efficiency gain a significant “green premium” in the local market. Documenting your measuring energy savings after insulation journey creates a heritage of quality for your property. It’s an investment in the home’s future narrative, ensuring it remains a high-performing sanctuary for decades to come. Taking this final step with a bespoke consultancy approach ensures that your home isn’t just improved, but truly transformed into a timeless reflection of quality and care.
Perfecting the Narrative of Your Thermal Sanctuary
Your home’s transformation is a journey that deserves a definitive ending. By moving past the deception of raw utility bills and embracing the meticulous science of Heating Degree Days, you’ve learned to isolate the 15% savings that Energy Star associates with proper insulation. This analytical approach strips away the noise of the Pennine microclimate, revealing the true efficiency of your property’s soul and ensuring your investment is grounded in reality.
You’ve discovered that measuring energy savings after insulation is a dual process. It’s found in the rhythmic data of your smart meter and the sensory peace of a draught-free hallway. This balance of technical metrics and humidity monitoring ensures your home remains a breathable, high-performing sanctuary. Documenting these gains doesn’t just provide peace of mind; it builds a lasting legacy of quality and a potential green premium for your property.
To secure the ultimate validation for your property’s performance, Book a Meticulous Retrofit Assessment for Your West Yorkshire Sanctuary. Our specialists provide PAS 2035 aligned assessments and comprehensive EPC improvement roadmaps tailored to your home’s unique story. Embrace the quiet confidence of a space that is as efficient as it is beautiful. Your journey toward a refined, sustainable lifestyle is now firmly within your grasp.
Frequently Asked Questions
How long does it take to see the real savings after installing new insulation?
You typically need a full heating season, spanning from October to April, to establish a weather-normalized comparison. While immediate drops in consumption occur, measuring energy savings after insulation requires comparing a full winter’s data against your historical baseline. This patience allows the home to reach a new thermal equilibrium, accounting for the natural lag in building material temperature adjustment during the first few months.
Why are my energy bills still high after insulating my loft and walls?
High bills often stem from rising energy tariffs or an exceptionally cold winter rather than a failure of the insulation itself. If national energy prices rose significantly in early 2026, your financial savings might be masked despite a lower kilowatt-hour usage. Additionally, the rebound effect might lead you to enjoy a higher internal temperature than you previously could afford, subtly altering your expected financial return.
What is a good percentage of energy reduction to expect after a full retrofit?
A comprehensive retrofit can reduce space heating demand by 15% to 25% depending on the property’s initial state. These figures represent a significant shift in the home’s thermal narrative and are supported by current PAS 2035 standards. The exact percentage depends on the seamless integration of insulation, high-performance windows, and updated heating systems working in concert to protect the building’s soul.
Can I use my smart meter to calculate my insulation’s ROI?
Yes, smart meters provide the granular, half-hourly data necessary for measuring energy savings after insulation with high precision. By exporting this usage data and comparing it to local Heating Degree Days, you can calculate your energy signature. This allows you to see the financial return through genuine consumption reduction rather than just the fluctuating total on your monthly bill.
What happens if I insulate my home but don’t improve the ventilation?
Insulating without addressing ventilation can lead to trapped moisture and a rise in relative humidity above the ideal 40% to 60% range. This imbalance creates a risk of interstitial condensation and dampness as the building’s natural breath is restricted. A meticulous whole-house approach ensures that as we seal the sanctuary, we also provide a curated path for fresh air to circulate throughout the space.
How does the West Yorkshire climate affect my expected energy savings?
The Pennine microclimate, characterized by higher wind speeds and damp mists, can increase heat loss through wind washing in poorly installed insulation. Properties in Halifax or Huddersfield often require a higher standard of draught proofing to maintain their thermal essence. These local conditions mean your savings will be more pronounced during the biting winters typical of the region’s 1,800 annual Heating Degree Days.
Is a professional thermal imaging survey worth the cost after insulation?
A professional thermal imaging survey is an invaluable tool for visualizing the invisible success of your home’s transformation. It identifies minor thermal bridges or gaps in the insulation that could compromise the entire narrative of efficiency. This visual evidence provides technical peace of mind, confirming that your sanctuary is protected by a continuous, meticulously crafted cloak of warmth that leaves no detail unattended.
How often should I monitor my home’s humidity after major energy upgrades?
You should monitor your sanctuary’s humidity daily during the first winter following major upgrades to establish a healthy baseline. Once you understand how your home responds to different weather patterns, a weekly check with a hygrometer is usually sufficient. Maintaining a curated environment between 40% and 60% humidity ensures the long-term health of both the building’s soul and its inhabitants as they enjoy their restored space.